End-to-End Machine Learning(Image Classifier) Project on Amazon SageMaker
A Guide to Training, Monitoring, and Deploying Machine Learning Models in AWS" serves as an essential tutorial for leveraging Amazon SageMaker's comprehensive tools and services to simplify the machine learning lifecycle. This insightful article walks readers through the intricate steps of creating, training, and deploying machine learning models using AWS, starting from the initial setup of an AWS account to the final deployment of a model. It covers crucial processes such as data preparation, model training with pre-trained or custom models, hyperparameter tuning, and creating endpoints for model deployment. Additionally, the guide delves into creating Lambda functions and API gateways for integrating machine learning models into applications. With a focus on practical applications, this article is a valuable resource for developers and data scientists aiming to harness the power of cloud computing for their machine learning projects, ensuring a smooth journey from concept to production.
Fine Tuning Large Language Models with Custom Data
This project showcases the innovative utilization of a pre-trained language model, LLaMA, as the foundational framework for improving summarization capabilities. By engaging in fine-tuning with a rich dataset of customer and agent conversations, the initiative has significantly enhanced the model's summarization accuracy. The meticulous fine-tuning, specifically targeted at custom data, has led to a noteworthy 15% improvement in model accuracy. This advancement not only highlights the effectiveness of the fine-tuning process but also sets a new standard for accuracy in the field of automated conversation summarization. It demonstrates the vast potential for further advancements in natural language processing applications, leveraging refined and efficient methodologies.
Time Series Sales Forecasting and Accuracy Enhancement using Machine Learning
This project marks a significant advancement in the field of sales forecasting through the development of a cutting-edge time series forecasting model. By integrating diverse machine learning algorithms, including Long Short-Term Memory (LSTM), 1-Dimensional Convolutional Neural Networks (1D CNN), and Gated Recurrent Units (GRU), the team has paved the way for more accurate predictions of future sales. The project's success is further underscored by the achievement of a remarkable 15% increase in model accuracy, a result of expertly conducted hyperparameter tuning and optimization techniques. This breakthrough not only demonstrates the potential of combining various machine learning approaches but also sets a new benchmark for precision in sales forecasting models, offering valuable insights for strategic planning and decision-making.
Determining the Quality of Brain Stripped MRI Images
This project presents a solution to the challenging task of evaluating the quality of skull stripped brain MRI images. In the field of neuroimaging research, such images are frequently shared in open access data repositories. However, ensuring the accuracy and reliability of the segmentation results is a time-consuming process. To address this issue, the authors propose a deep neural network algorithm based on 3D Convolutional Neural Networks (CNN). By leveraging the power of CNNs and their ability to analyze 3D medical data, the algorithm automates the inspection of skull stripped MRI images and aims to improve the overall accuracy of the segmentation process.
SkimLit: Multi-Modal Sequential Sentence Classification with Bidirectional LSTM and Tribrid Embeddings
Engineered Conv1D architecture with character embeddings, creating models incorporating pre-trained token embeddings, bidirectional LSTM, and tribrid embeddings, displaying expertise in feature extraction and model architecture. Constructed a tribrid model integrating tokens, characters, bidirectional LSTM, and positional embeddings through adept application of pre-trained token embeddings and transfer learning, optimizing contextual comprehension.
Rating Predictions from reviews given to products in online markets
This project aimed to develop effective models for fine-grained aspect-based analysis of product reviews in natural language processing. Data cleaning steps were performed, and exploratory data analysis was conducted. Three models were implemented: 1D CNN, RNN/LSTM, and BERT. However, the models did not perform as well as expected, with accuracy scores below the desired level. Despite the limitations, valuable insights were gained, emphasizing the challenges in fine-grained aspect-based analysis.
Real-Time Face Mask Detection
Built a model for real-time face mask detection using machine learning and data science algorithms. It utilizes Streamlit, TensorFlow, Keras, and OpenCV. The authors train a model using a dataset of masked and unmasked faces, achieving a 99.78% accuracy rate. The trained model is deployed in a web application that captures live video streams and displays real-time predictions of mask usage. The proposed method offers an effective and accessible approach to preventing the spread of COVID-19.
Streamlit-based Movie Recommender System with Content-Based Recommendations
Developed a Python web application using Streamlit for personalized movie recommendations, implementing a content-based recommender system with vector space methods. Demonstrated proficiency in web development, recommendation systems, and Python programming while creating an interactive and user-friendly movie recommender system.
Data-Driven Sales Analysis: Adventure Works with Power BI & DAX
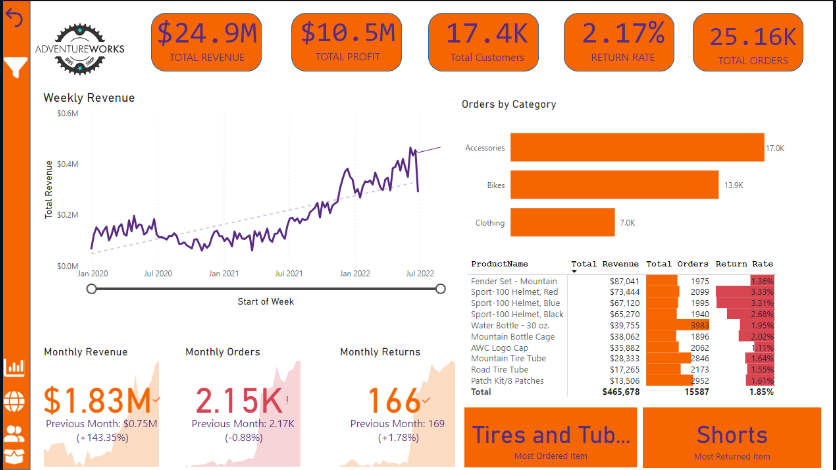
In my Adventure Works Sales Analysis project, I conducted an in-depth analysis of the sales data for the company "Adventure Works" using Microsoft Power BI and DAX. The project aimed to gain valuable insights into the company's sales performance and customer behavior. Through interactive visualizations and dynamic dashboards, I analyzed weekly revenue, profit, and return rate orders, enabling stakeholders to understand key trends and make data-driven decisions. Additionally, I examined monthly revenue, orders, and returns to identify patterns over time, while also determining the most returned and most ordered items. This analysis provided crucial information for product improvements and customer satisfaction enhancements. The project showcases my strong analytical skills and proficiency in data analysis tools, as well as my ability to present complex data in an intuitive and visually appealing manner.
The Stock Performance Analytics Dashboard: Analyzing TESLA Stock's Trends and Insights
The Stock Data Analysis and Dashboard Project was a comprehensive undertaking aimed at evaluating the performance of Test Stock over recent months. Utilizing Python, I skillfully scraped relevant financial data from a reputable source, including daily close prices, high and low prices, traded volume, and open-close changes for each trading day. The collected data underwent thorough analysis, and I computed essential metrics like the highest price, lowest price, and average closing price for the past 3 months. Building on this analysis, I harnessed the power of Pandas, Dash, and Plotly to craft an interactive dashboard that effectively conveyed the stock's behavior. The dashboard featured four visually engaging graphs displaying the daily close price, daily high and low prices in a candlestick chart, traded volume in a bar chart, and the open-close change in another bar chart for a specific date. Additionally, I implemented a filter functionality to enable users to explore the stock's performance over customizable time durations. The project showcased my strong data analysis skills, web scraping expertise, and ability to deliver user-friendly data visualizations that empower stakeholders to make informed financial decisions.
WeWashUSleep Startup Sales Data Dashboard
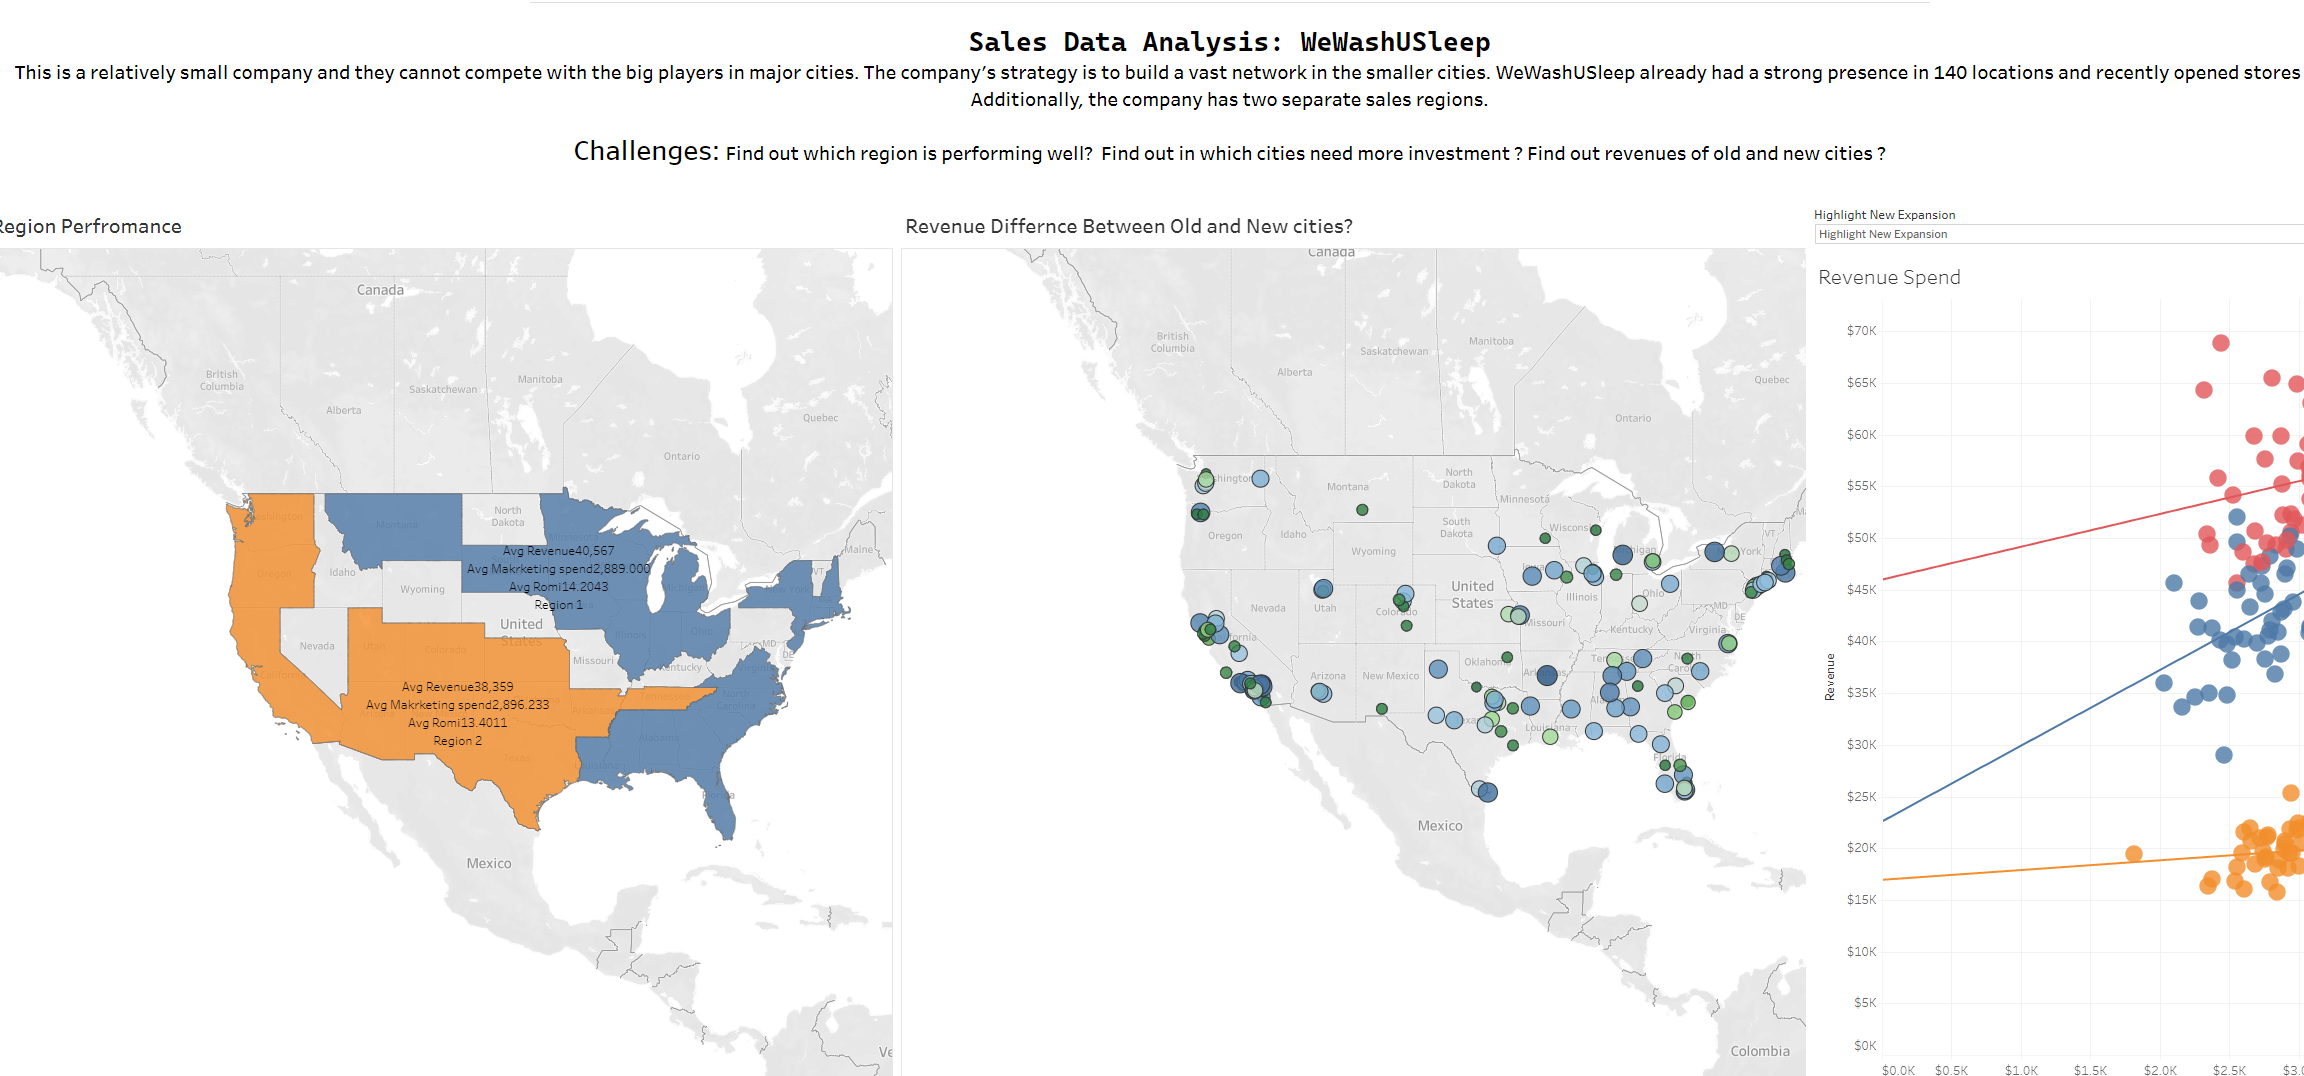
Explore our Tableau-based Sales Data Dashboard for WeWashUSleep, a startup focused on expanding its network in smaller cities. This interactive dashboard offers insights into regional sales performance, revenue comparisons between established and new cities, and aids investment decisions based on population and marketing spending. Uncover trends, make informed decisions, and drive growth with actionable data insights.
Bank Customer Insights Dashboard
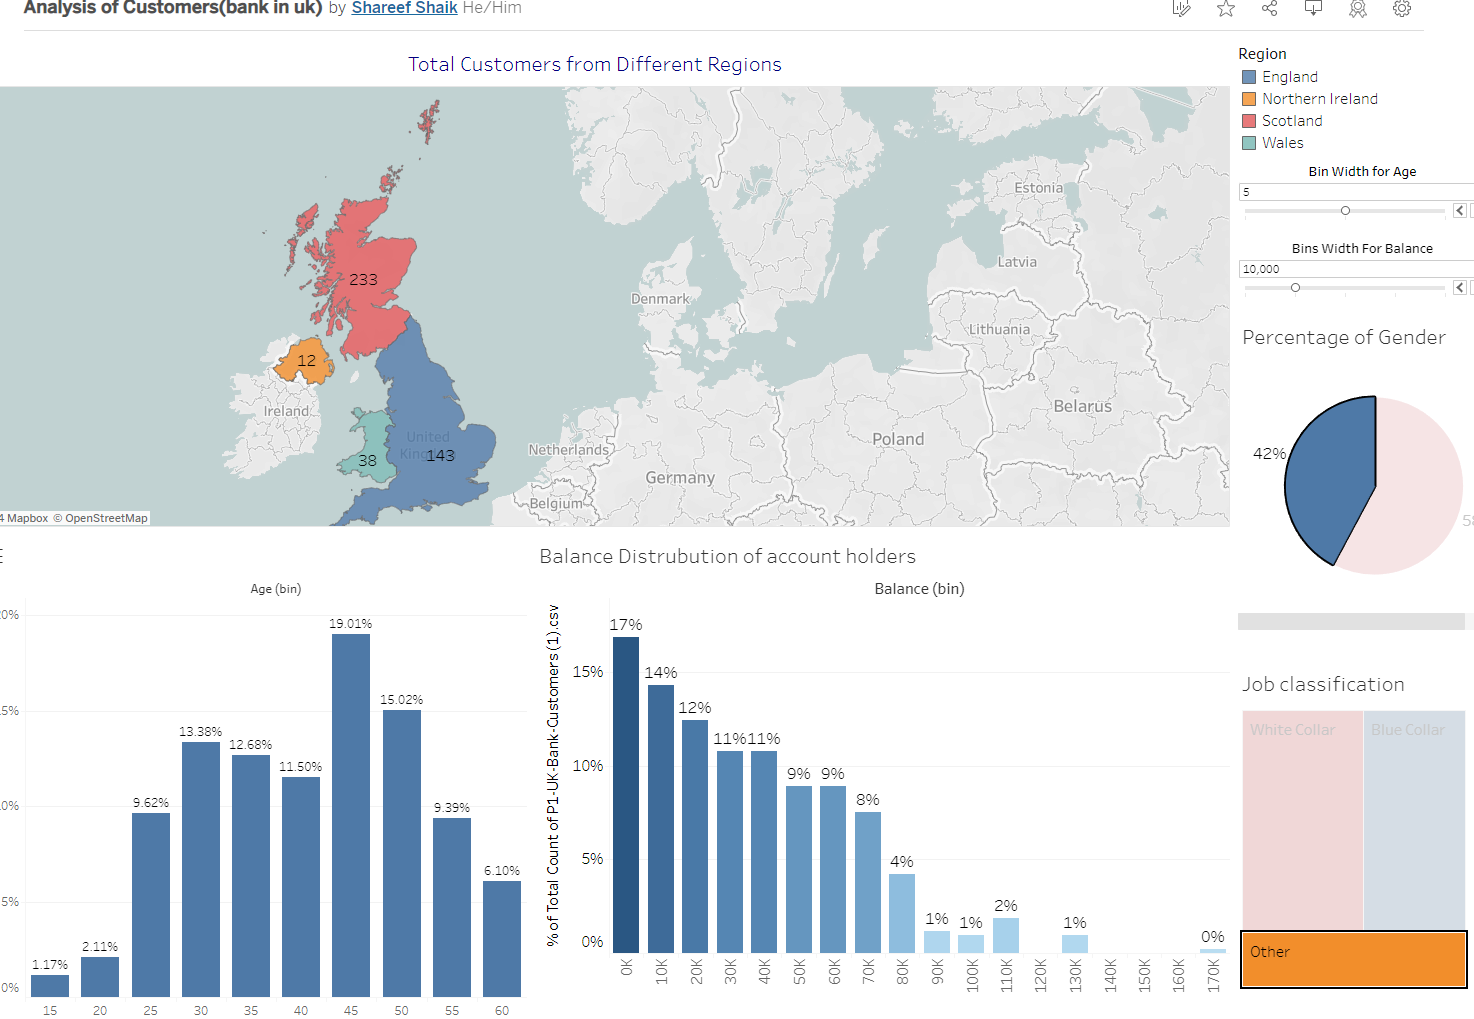
Delve into the intricacies of our Bank Customer Insights Dashboard – a powerful Tableau-driven tool that paints a vivid picture of our diverse customer landscape. Explore regional customer distribution, gauge age group dynamics, scrutinize account balance trends, dissect occupation preferences, and grasp gender ratios. This comprehensive visualization toolkit equips decision-makers with the precise insights needed to sculpt targeted strategies, optimize resource allocation, and propel the bank towards informed growth. Unveil the data story and steer your financial journey with precision.
📊 ChatGPT Analytics Dashboard
During the ChatGPT Analytics Dashboard project, I demonstrated my expertise in data analysis, web scraping, and visualization using Power BI and DAX. As part of the project, I harnessed the power of Power BI and DAX to perform in-depth data analysis and create interactive dashboards and reports. Leveraging web scraping techniques, I collected data from various online sources and APIs, enabling a comprehensive understanding of ChatGPT usage trends, awareness levels, and traffic sources. The resulting dashboards provided valuable insights, such as the time taken to reach one million users and the most engaged countries.
Analyzing Workforce Insights with SQL
In this project, I spearheaded the development of an interactive Tableau dashboard that provided comprehensive insights into the workforce. Leveraging my SQL expertise, I crafted data queries and created stored procedures to extract relevant information, including employee gender breakdown and average annual salary. The dashboard facilitated detailed data analysis, enabling stakeholders to make informed decisions and optimize workforce management strategies.
